Coordinate systems and map projections are super important because they help us accurately represent locations on Earth, align data from different sources, and minimize distortions when we create flat maps from a round planet. Without a consistent coordinate system, like latitude and longitude, we wouldn’t be able to pinpoint locations or analyze spatial data properly. Projections help us handle the tricky task of flattening the Earth by letting us control how things like shape, distance, and direction are distorted. This is key for everything from navigating and measuring distances to creating visually accurate maps. In short, they ensure that our maps and data make sense and work correctly across different applications.
Continue readingPosts Tagged → GIS
The Hidden Bias in Maps
Learning the Modifiable Spatial Unit Problem (MAUP)
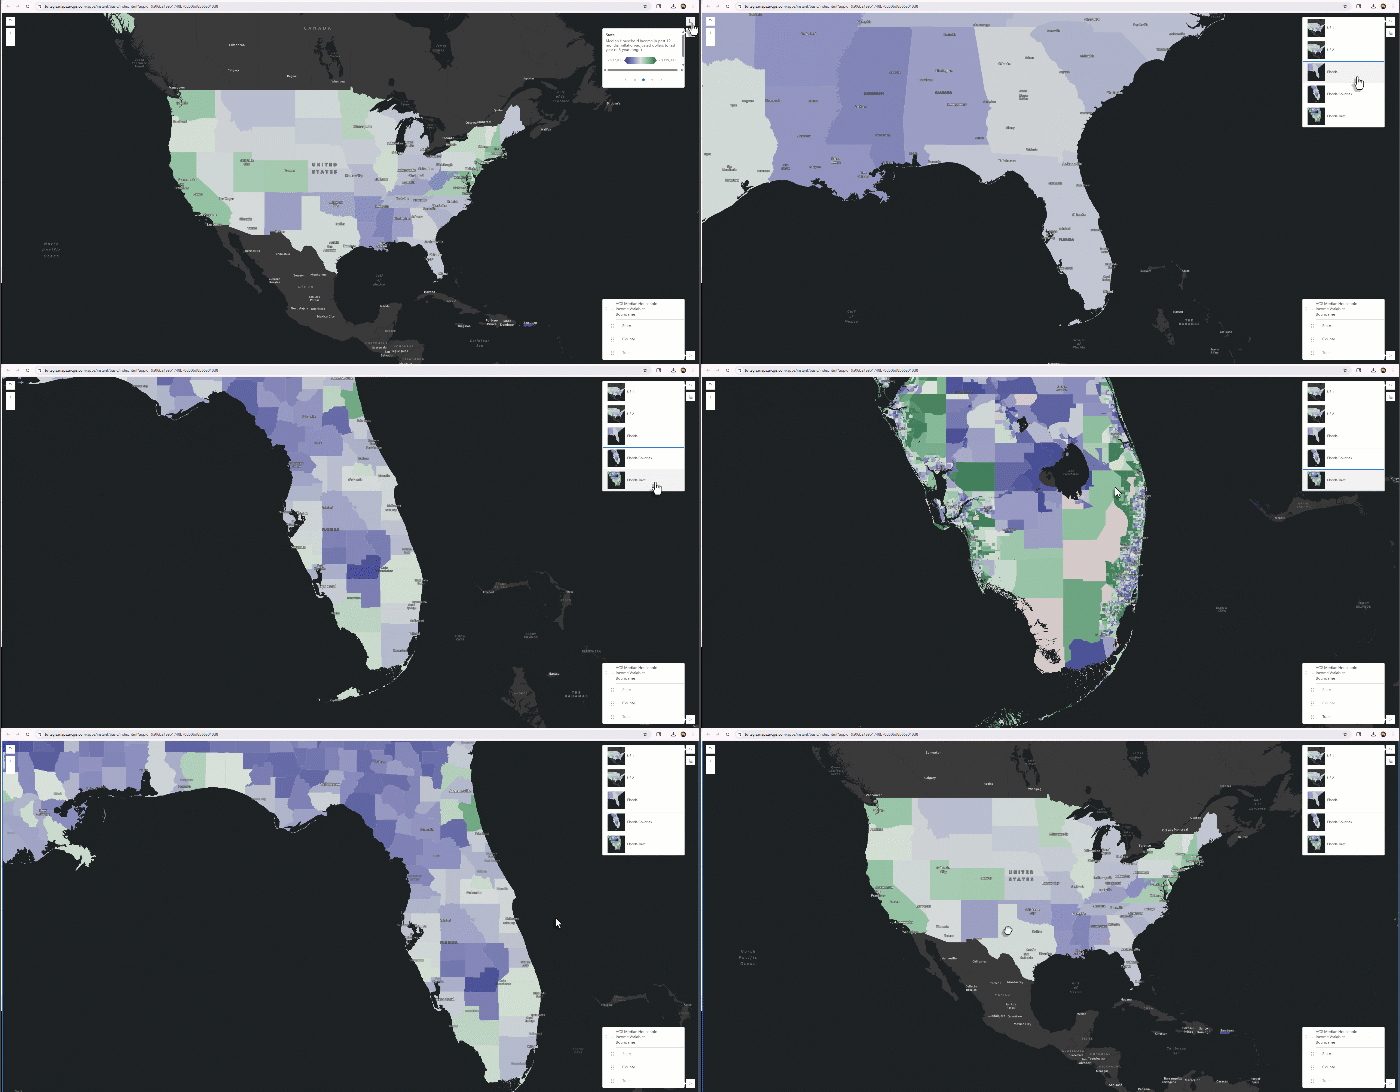
Have you ever noticed how the way we draw boundaries on a map can totally change the story the data tells? Think about it: if we look at average income by State, we might see big differences county by county… But if we zoom in and look at income by tract, the data will tell us something different! Same data, different story.

Cartographic Principles, Classification and Symbology
Cartography is the art and science of making maps, and in the context of geographic information systems (GIS) it is a critical step in turning data into information people can actually use. Maps are not just pictures of geography—they are carefully designed tools that help us navigate, see patterns, understand relationships, and share knowledge about the world around us.
A map’s effectiveness comes not only from the data behind it, but also from how its elements are designed and organized. Titles, legends, scale bars, symbols, and the map body all play a role in communication—but whether they succeed depends on applying solid cartographic principles.
In this post, we’ll first walk through six of the most important cartographic principles that every mapmaker (and GIS user) should consider when designing a map. We’ll then move into classification methods and symbology, which are essential for turning data into clear and meaningful visual stories.
Continue reading