
Coordinate systems and map projections are super important because they help us accurately represent locations on Earth, align data from different sources, and minimize distortions when we create flat maps from a round planet. Without a consistent coordinate system, like latitude and longitude, we wouldn’t be able to pinpoint locations or analyze spatial data properly. Projections help us handle the tricky task of flattening the Earth by letting us control how things like shape, distance, and direction are distorted. This is key for everything from navigating and measuring distances to creating visually accurate maps. In short, they ensure that our maps and data make sense and work correctly across different applications.
Let’s dive into the fundamentals of coordinate systems and projections. When it comes to turning the real Earth into a map, there are three key concepts you need to understand:
- Coordinate System – This is the X and Y axis that is applied to a flat map, helping to pinpoint locations.
- Geoid and Datum – This is a reference model that describes the size and shape of the Earth, serving as the foundation for creating a map projection.
- Map Projection – This is the process of transforming the curved surface of the Earth onto a flat map, accounting for the distortions that occur during the process.
Coordinate Systems
Data typically consists of numbers, and spatial data is no different—except that it includes numbers that let you place it on the Earth’s surface. These numbers are part of a coordinate system, which acts as a reference frame for your data. This system helps you pinpoint locations, align your data with other spatial datasets, ensure spatial accuracy for analysis, make edits, and ultimately create accurate maps. Let’s take a closer look at how this works.
Geographic Coordinate Systems
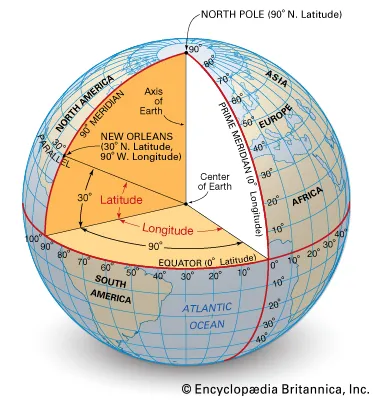
Latitude and longitude help us find specific locations on the Earth’s surface. Latitude tells us how far north or south we are from the equator, while longitude shows how far east or west we are. But there’s a catch—latitude lines stay evenly spaced, while longitude lines get closer together as you move toward the poles, making it trickier to measure distances accurately.
To make things easier, we use a flat coordinate system with X and Y axes, like a grid. This makes calculating distances and areas much simpler compared to doing it on a curved surface like the Earth.
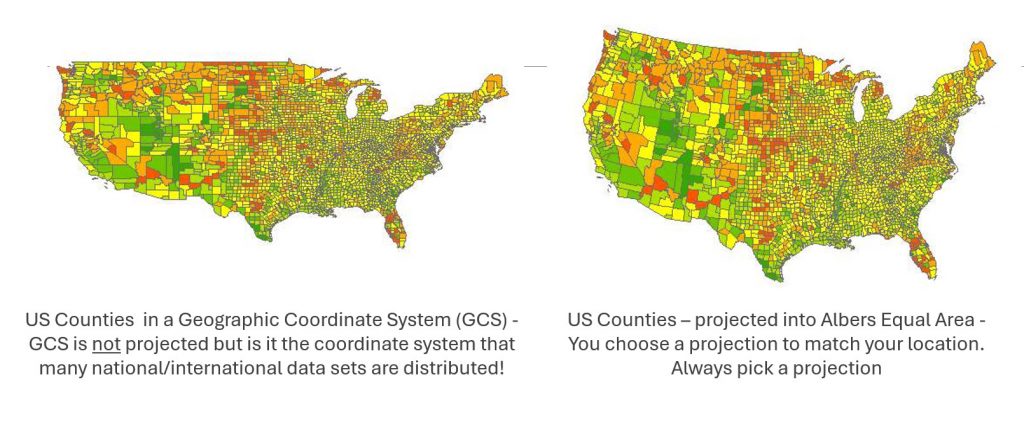
When we talk about latitude and longitude, we’re using a geographic coordinate system (GCS), which helps us find places on Earth using a three-dimensional spherical surface. But here’s the thing—the only time you should use a GCS is when you’re adding X, Y, (latitude/longitude) data. Why? Because latitude and longitude are already in decimal degrees, so they need to stay in a system that also works in decimal degrees to ensure everything lines up correctly.
However, if you try to use GCS to create a map, it can look pretty distorted and messy. Take a look at the two maps below and compare the differences.
Projected Coordinate Systems
The Earth’s surface—and the geographic coordinate system —are round, but your map and computer screen are flat. And that’s a big challenge. You can’t represent the round Earth on a flat surface without some distortion. Imagine peeling an orange and trying to lay the peel flat on a table. You can almost do it, but only by tearing and stretching the peel.
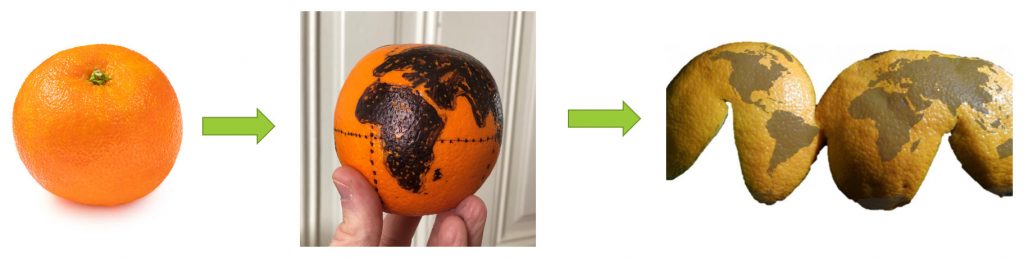
That’s where projections come in. They show you how to distort the Earth—how to stretch and tear that ‘orange peel’—so the most important areas on your map experience the least distortion and look their best on the flat surface.
We’ll dive deeper into the concept of projections later. But first, let’s explore two important concepts: the Geoid and the Datum.
Geoid and Datum
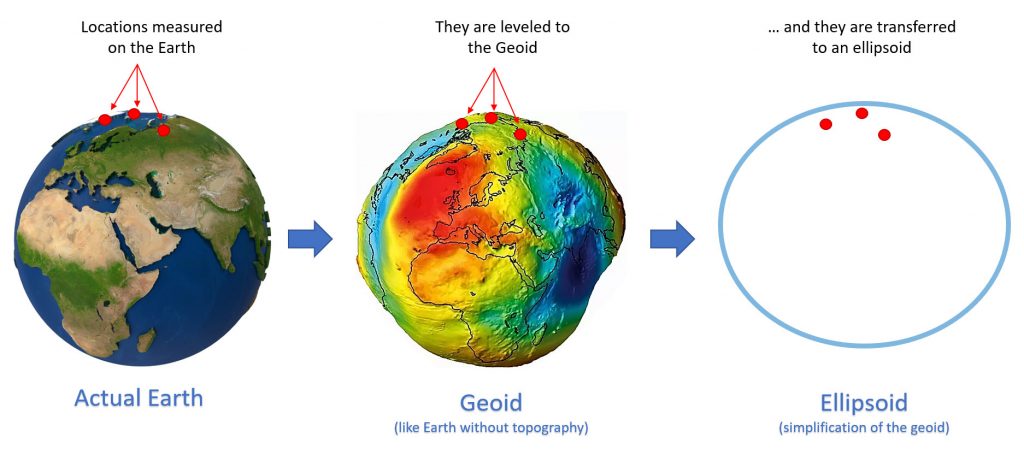
Once again the Earth is not a perfect sphere—it has uneven terrain, varying ocean levels, and other irregularities. Geodesy, the science of measuring and understanding the Earth’s shape and gravitational field, addresses this complexity, allowing us to represent these variations more precisely.
The term ‘geoid‘ refers to a geophysical model of the Earth’s shape, representing what the Earth’s surface would look like if shaped solely by gravity and rotation, as if it were covered in water. While the geoid offers a useful conceptual understanding, it is not practical for mapping or navigation. Instead, we rely on a mathematical model, such as an ellipsoid, to accurately assign latitude and longitude coordinates.
Datum
A geodetic datum is like a reference system that helps us map the Earth by providing known starting points, usually based on something like sea level. Think of it like giving someone directions to your house, you always start with a familiar point, like a crossroads or a well-known building.
In the same way, geodesists and surveyors use datums as starting points when creating maps, measuring property boundaries, or working on things like floodplain maps and construction projects. It ensures that all the coordinates are consistent and accurate for whatever work they’re doing.
There are two main types of datums that are commonly used:
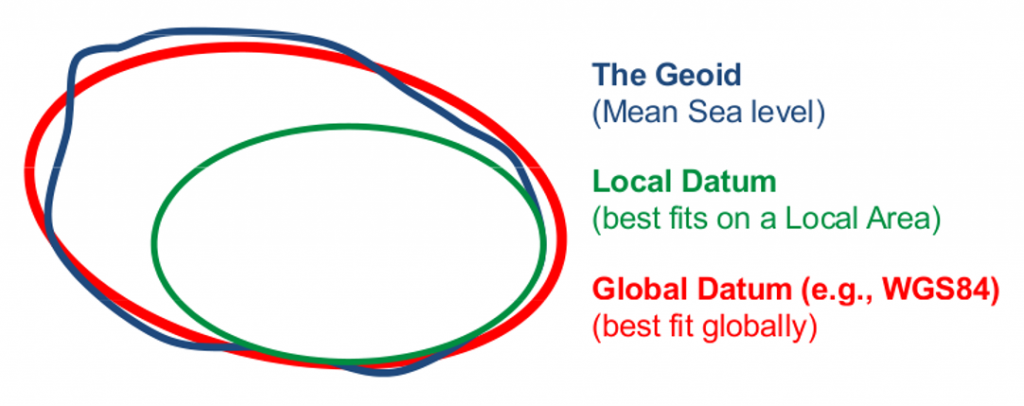
- Geocentric datums: A geocentric, or Earth-centered, datum uses the Earth’s center of mass as its starting point. This makes it perfect for global mapping and positioning because it provides a consistent reference no matter where you are on the planet. It’s especially important for technologies like GPS, which need accurate location data anywhere in the world. Unlike older datums that were focused on specific regions, geocentric datums work on a worldwide scale, making them much more versatile.
- Local datums: A local datum is set up to provide accurate location data for a specific area, like a country or region, rather than the entire Earth. It’s based on a reference point within that area, which makes it very precise locally, but less accurate the farther you move from that region. Before global systems like GPS became common, local datums were widely used for things like mapping, land surveys, and construction projects in a specific location.
When creating or working with maps, it’s crucial for a cartographer to know which datum is being used. Datums serve as the reference points for positioning, and using the wrong one can throw off the entire map. It’s like starting directions from the wrong place—it could result in significant inaccuracies.
Projections
Let’s dive into map projections. A map projection is a method for displaying a coordinate system and your data on a flat surface, whether it’s a piece of paper or a digital screen.
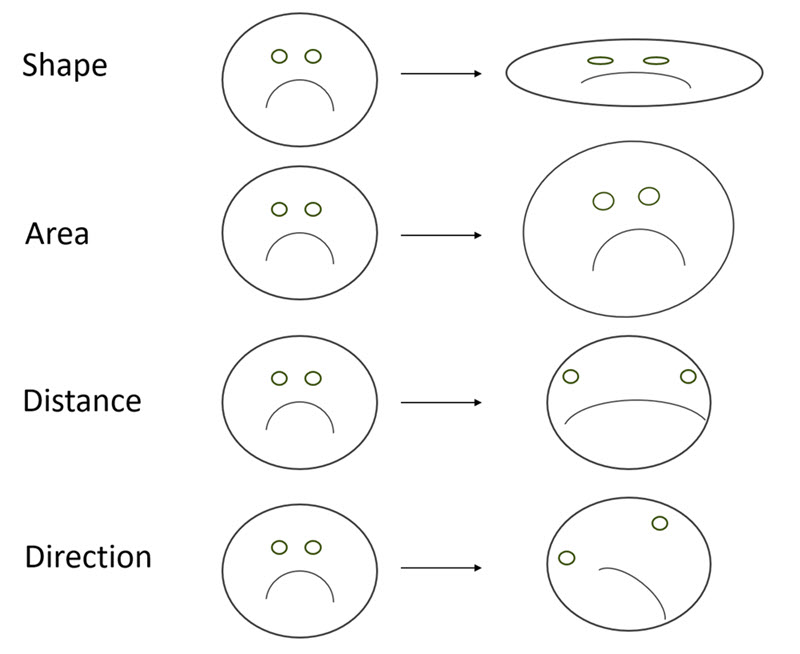
However, no projection can perfectly represent the Earth without some level of distortion. Whenever we represent the Earth’s curved surface in two dimensions, there will always be some distortion—whether in shape, area, distance, or direction. Map projections manage this distortion in a systematic way, allowing you to control where and how it occurs so that the map meets your specific needs. It’s similar to drawing a map on an orange and peeling it to lay the surface flat, some parts will stretch or tear.
A great start is the report from the USGS on map projections (click here to access the report). It provides a clear summary of the different types of projections, explaining how each one works and what it’s best suited for.
In GIS, SADD stands for Shape, Area, Distance, or Direction, and it refers to the distortion that occurs when a 2D projection is used to represent the Earth’s 3D surface on a flat map. When we project the Earth’s curved surface onto a flat map, we can’t preserve all these properties perfectly, something has to give. Some projections keep the shape of objects accurate, but distort their size. Others maintain accurate distances or directions, but may warp shapes. This trade-off is what makes choosing the right projection important depending on what you’re trying to map. So, whether you’re looking to preserve shape, area, direction, or distance, a projection will always sacrifice one or more of these to some degree.
Projection Types
There are different projection types. Conformal projections keep angles accurate locally, so the shapes of features look correct. However, the trade-off is that areas and distances can be distorted. On the other hand, equal area projections maintain the true size of areas, but this comes at the cost of distorting shapes, so some places might look skewed. Equidistant projections focus on preserving distances, but only from certain points or along specific lines on the map.
Projected coordinate systems make it much easier for us to study and explore different parts of the Earth without having to carry a big globe around. They’re not only great for visualizations but also for accurately calculating distances and areas, which is crucial for data analysis. If you’re using the wrong coordinate system for your analysis, you’ll likely run into warnings or errors, and your results could be off. So, in short, using the right projection is essential for accurate data analysis and making sure your calculations and maps are reliable.
Key Points
People often use ‘Projected Coordinate Systems’ and ‘Projections’ as if they mean the same thing, but they’re actually different. A projection is just one part of a projected coordinate system. Other important components include the geographic coordinate system, a linear unit (like meters or feet), and specific settings related to the chosen projection, such as the central meridian or scale factor.
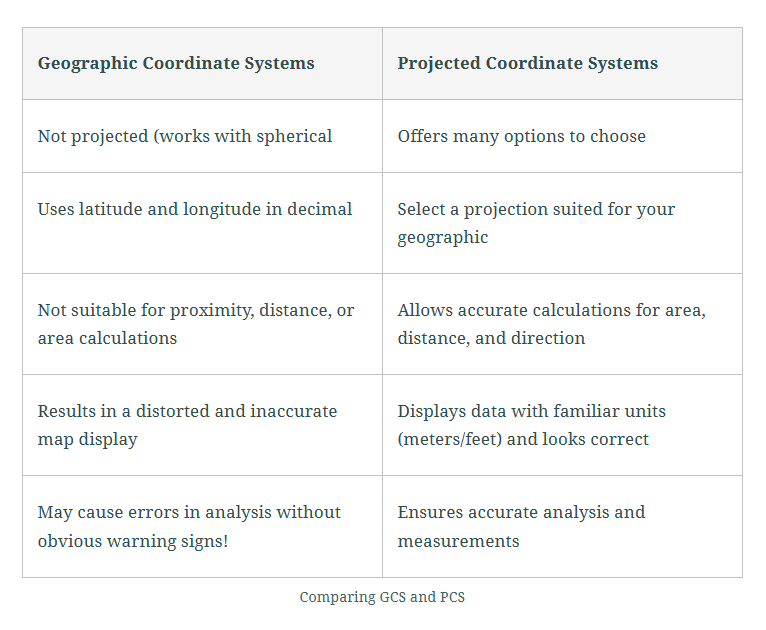
Geographic vs Projected Coordinates
And don’t forget—datums are the foundation of both geographic and projected coordinate systems! They help define the shape and size of the Earth for accurate mapping and positioning.
These are the key points to keep in mind:
- Choose a projected coordinate system that fits your specific area of interest.
- Make sure to set your map to a projected coordinate system.
- The first layer you add to your map should already be in the projection you want because this will automatically set the map’s projection to match.
- When doing any spatial analysis, all the data layers you use should be in the same projected coordinate system to ensure accuracy.
To-do’s List for Projects
- Make sure you know the area you’re working with and choose the best projection for that region. Don’t hesitate to experiment by adjusting the map properties and trying different projections. Take a look through the list of available projections to find the one that works best for your specific needs.
- Once you’ve decided on the projection you want to use, set your map to that projection. Alternatively, you can insert a new map and add a layer that you know is already projected correctly.
- Add the rest of your layers (i.e., feature classes or shapefiles) to the map. Be sure to check each layer’s source tab to view the coordinate system information and confirm it matches the map’s projection!
- If a layer isn’t in the right projection, use the Project Tool to set it to the correct one.
- Make sure to remove the original layer that was in the wrong projection.
And just for fun!
If you’re interested in exploring map projections further, Penn State University offers an Interactive Album of Map Projections, which you can check out here: Penn State Interactive Album.
For even more in-depth information, the International Institute for Geo-Information Science and Earth Observation (Netherlands) has a great resource on their Kartoweb page: Kartoweb Map Projections. These are great tools if you want to dive deeper into the world of map projections!
A video done by NASA called Looking Down a Well: A Brief History of Geodesy.