Closing the Gender Gap in STEM Careers, Improving Living Conditions in Informal Settlements and Urban Slums, The Situation in the DRC, and The State of Kosovar Independence.

Closing the Gender Gap in STEM Careers, Improving Living Conditions in Informal Settlements and Urban Slums, The Situation in the DRC, and The State of Kosovar Independence.

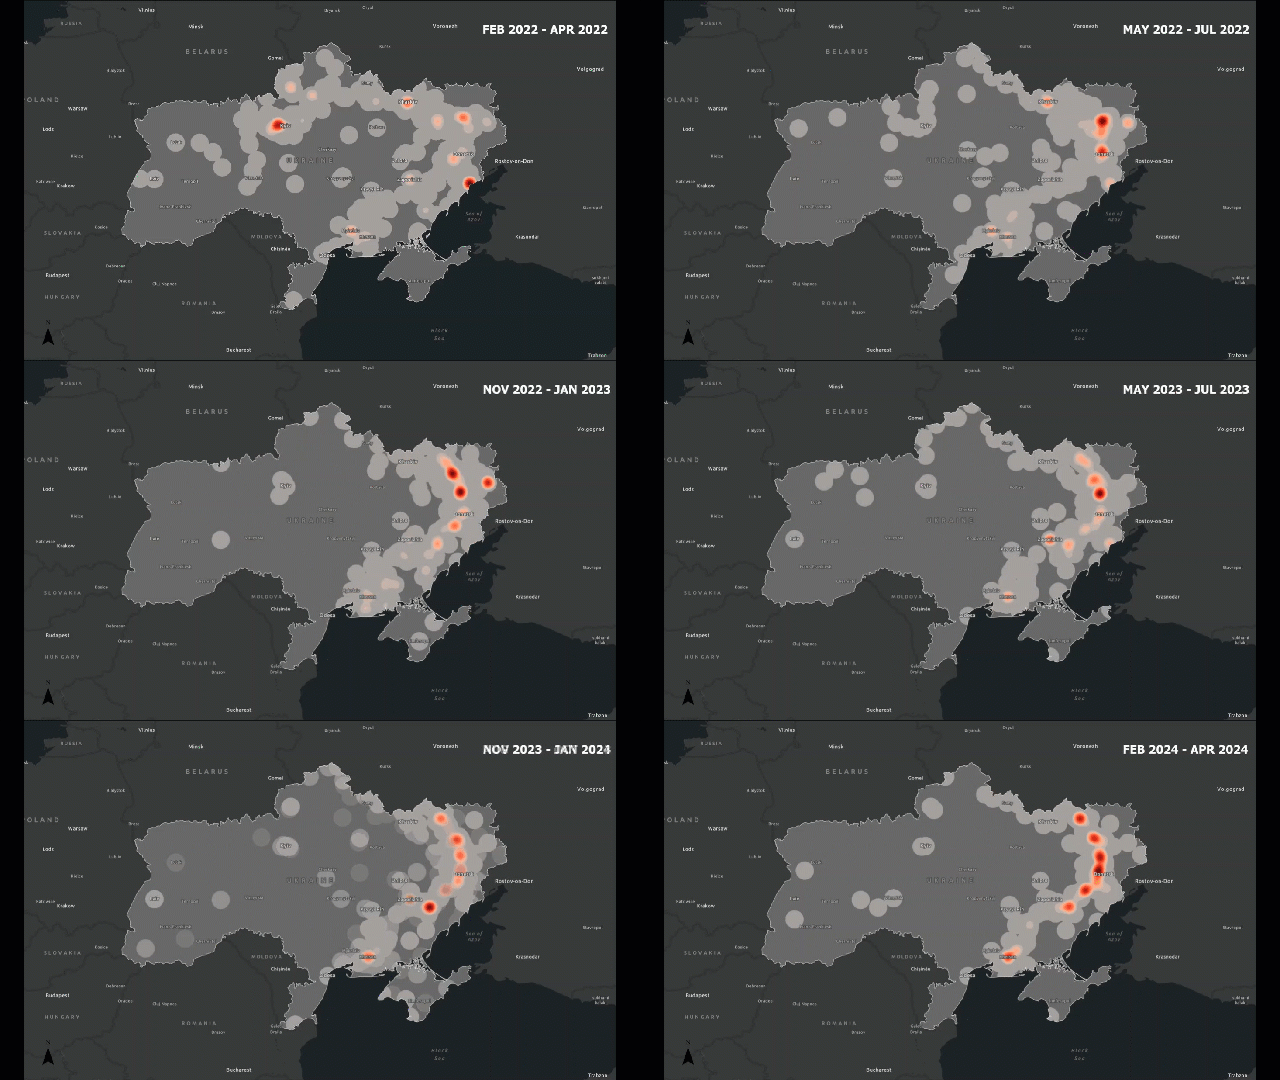
Have you ever wondered why certain types of conflict seem to cluster in specific regions — or why some areas remain peaceful?

Traditional analysis might count how many incidents occur. Spatial analysis lets us see how those incidents are arranged — are they clustered around borders, along roads, or near population centers?
For example, in a conflict zone, we might find that attacks cluster along major highways or near disputed boundaries. This pattern tells us something about accessibility, control, or strategic importance — insights that are invisible in non-spatial data.
Here is where spatial analysis plays a huge role.
Continue reading
Best Practices to Import Data for GIS
Working with GIS often starts with good data—and for many of us, that means working with Excel tables. Before importing your spreadsheets into ArcGIS Pro, it’s important to clean and format them properly. A little preparation upfront can save you a lot of time (and errors) later on.
To make this easier, I’ve created a series of short tutorial videos that walk you through some of the most useful tips and tricks for cleaning Excel files before bringing them into ArcGIS Pro. But first, let me walk you through a couple of points on why it is important.
Continue readingCoordinate systems and map projections are super important because they help us accurately represent locations on Earth, align data from different sources, and minimize distortions when we create flat maps from a round planet. Without a consistent coordinate system, like latitude and longitude, we wouldn’t be able to pinpoint locations or analyze spatial data properly. Projections help us handle the tricky task of flattening the Earth by letting us control how things like shape, distance, and direction are distorted. This is key for everything from navigating and measuring distances to creating visually accurate maps. In short, they ensure that our maps and data make sense and work correctly across different applications.
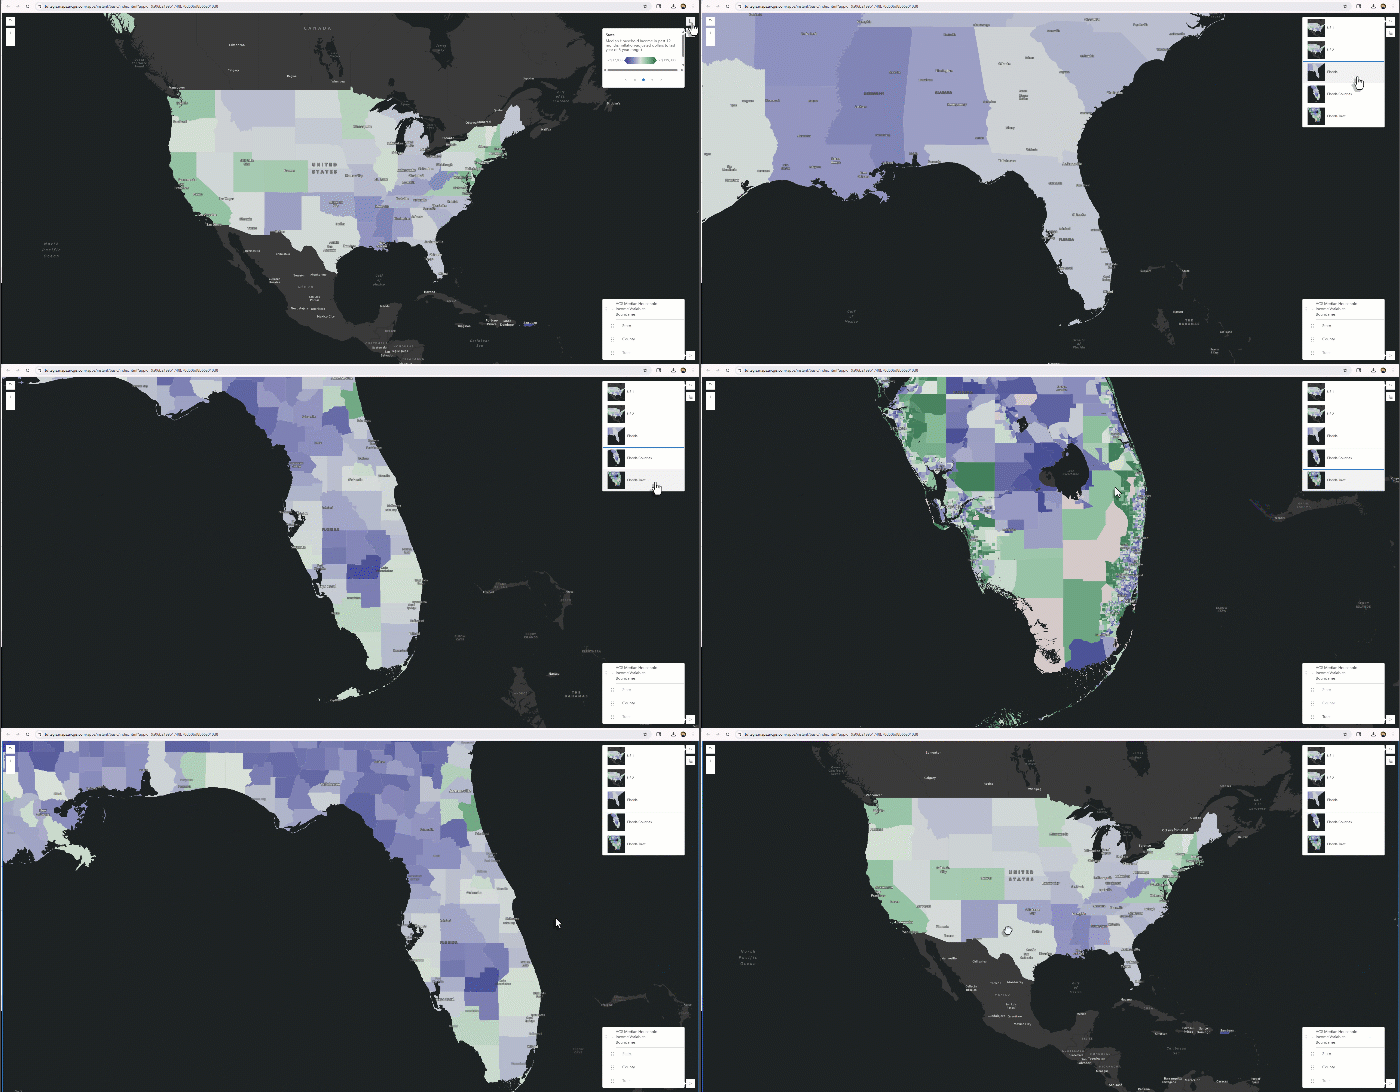
Continue readingHave you ever noticed how the way we draw boundaries on a map can totally change the story the data tells? Think about it: if we look at average income by State, we might see big differences county by county… But if we zoom in and look at income by tract, the data will tell us something different! Same data, different story.

When you’re first exploring a data portal, it can be tempting to download and add every layer you see. After all, more data feels like more power, right? But in GIS, adding too much information can quickly lead to cluttered maps, longer processing times, and even misleading results.
Continue readingCartography is the art and science of making maps, and in the context of geographic information systems (GIS) it is a critical step in turning data into information people can actually use. Maps are not just pictures of geography—they are carefully designed tools that help us navigate, see patterns, understand relationships, and share knowledge about the world around us.
A map’s effectiveness comes not only from the data behind it, but also from how its elements are designed and organized. Titles, legends, scale bars, symbols, and the map body all play a role in communication—but whether they succeed depends on applying solid cartographic principles.
In this post, we’ll first walk through six of the most important cartographic principles that every mapmaker (and GIS user) should consider when designing a map. We’ll then move into classification methods and symbology, which are essential for turning data into clear and meaningful visual stories.
Continue readingThis site provides links to the most commonly requested geospatial datasets from some of the classes I teach. I also use some of this data myself, so in certain cases, I’ve included short videos to help guide you through data management or integrating the data into GIS.
Continue readingInterpolation is a method used to estimate values at locations where data hasn’t been directly measured. It works by using known values from surrounding points to predict the unknown ones, creating a continuous surface. This surface helps in mapping and analysis, making sense of scattered data.
Continue readingTableau is a powerful data visualization and business intelligence software that helps individuals and organizations transform raw data into insights. Known for its intuitive drag-and-drop interface, Tableau enables users to create dynamic dashboards, interactive visualizations, and detailed reports without requiring extensive technical expertise. Tableau supports data integration from multiple sources, including spreadsheets, databases, and cloud services, making it versatile for various industries and use cases.
Continue reading